Pages

2017-10-22

That is a Graph Problem!

English: A 4-node graph for illustrating conce...
English: A 4-node graph for illustrating concepts in transportation geography and network science. (Photo credit: Wikipedia)

Recently at the Data Modeling Zone conference I was asked how to identify a problem as something that should be solved with graph tools.

The difficulty, I think, for data modelers is that many of us with a relational background tend to think about the relationships of our data structures.

This table is related to this other table with a one-to-one relationship, or one-to-many, or many-to-one, or even many-to-many relationship.

There are whole books devoted to discussing how to create relational data models that support these relationships.

I wrote a little about Graph fundamentals here: http://bit.ly/GraphFundamentals, but applying these atomic definitions to a real world problem can be a bit of a stretch.

There are, however, a few words to key in on.

Path:

What is the path that a customer takes through our store?

English: Precedence graph Based on :Image:Dire...
English: Precedence graph Based on :Image:Directed.svg (Photo credit: Wikipedia)
This is clearly a graph type problem. It could also be a time-series type problem. If you want to look at an individual you would see one thing. If you take large sampling of your customer base and load that into a network visualization tool like Gephi then you may learn some new things, and gain additional insight into the layout of your store.

A path is about more than just the relationship between two things. It is about the relationship of many things, and how something (like a customer, or some data ) flows through the graph.

Learning the optimal path through a set of obstacles would require some iterative path analysis work.

These types of path questions are common in the human resource domain from the perspective of career path.

A segment of a social network
A segment of a social network (Photo credit: Wikipedia)
People:

Social Network Analysis is one of the practical applications of graph theory.

Milgrams experiments are key touch-points that are commonly mentioned trying to understand the degrees of separation of two items. How often do people speak to one another? Does Ann talk to Bob, then speak to Charlie all the time?

If Ann says something positive about your brand, will Bob and Charlie both like your product?

If Ann says something negative will your stock price go down?

Who is talking about your products and who is listening to them?
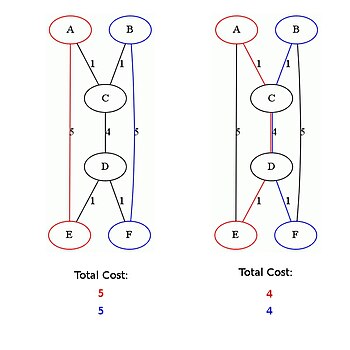

English: Example of the Shared Shortest Path P...
English: Example of the Shared Shortest Path Problem (Photo credit: Wikipedia)

Data Itself:

My thoughts about understanding how data movement, and data structures themselves can be thought of as a graph, I have written about previously: http://bit.ly/DataStructureGraph

Some other terms in similar context are Data Lineage, and Data Pipeline.

How does data flow through your organization?
How does it flow into your organization?

How does it flow out of your organization?

Once in your organization how many systems does the same data flow into and out of without enrichment?

Does this data really need to go into those systems?


Movement:

How does a thing (Package, Product, Person, or Participant) move that your company interacts with? Rarely does it move from only one place to another.

Each step in the thing moving from one place to another is part of a path mentioned above.

You may think that a product moving from a shelf, to a box, then on to a truck for delivery to a customer can all be handled by individual applications. This is entirely possible. the value to doing graph analysis is new insight into existing data.


I would never suggest that Graph Analysis or Network Science is the only way to look at a problem.
I would suggest hat these tools can provide new or unique insight into the problems where businesses are trying to solve problems related to :Paths, people, Data, or Movement.

After all, Data Science  applies a fresh perspective on our existing world.

We should all be trying to achieve more with our data.
2017-10-21

Sentiment Text ETL.

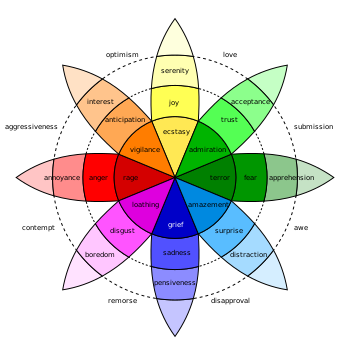
English: Robert Plutchik's Wheel of Emotions
English: Robert Plutchik's Wheel of Emotions (Photo credit: Wikipedia)
I attended a presentation by Bill Inmon where he spoke of the value to various businesses of his product called TextualETL.

There was a question in the audience about trying some of these text techniques ourselves, is there anything he could teach us.

The answer was less that satisfying to a do it yourself-er like some of us in the audience.

I have had some reason to do basic sentiment analysis at work recently and I was really looking forward to his talk.

Since the question was raised about how to get started in this area without totally going overboard, I will share some of my experiences.

I use R and SQL for the majority of my work, so the sentiment work will be some basic R code.

If there is some interest, please post a comment, and I will add this to my github for sharing.

Here is a small sample for doing sentiment:

library(syuzhet)
# Get sentiment on the comments of the source data set
sentiment_data <- get_nrc_sentiment(as.character(source_data_frame$Comments))
# Transpose rows to columns
transposed_sentiment_data<-data.frame(t(sentiment_data))
# Summarize the data so we have a single row per sentiment.
transposed_sentiment_data_summary <- data.frame(rowSums(td[1:length(transposed_sentiment_data)]))
# change the name of the result set
names(transposed_sentiment_data_summary)[1] <- "count"
transposed_sentiment_data_summary <- cbind("sentiment" = rownames(transposed_sentiment_data_summary), transposed_sentiment_data_summary)
rownames(transposed_sentiment_data_summary) <- NULL
# only get the emotional data into the subset.
subset_sentiment_data<-transposed_sentiment_data_summary[1:8,]
# display a quick plot
qplot(sentiment, data=subset_sentiment_data, weight=count,fill=sentiment) +ggtitle(plot_title)
# display a plot that is just positive or negative data.

qplot(sentiment, data=transposed_sentiment_data_summary[9:10,],weight=count,fill=sentiment)+ggtitle('Positive/Negative')


So long as your source data set has some business key stored in it, this data frame can be written out to a data base (I use snowflake), as a staging table, that is then transformed to a Fact table.

I created a small dimension table for sentiment like this:

Example of a database star schema. A central f...
INSERT INTO dim_sentiment VALUES
(1,'ANGER'),
(2,'ANTICIPATION'),
(3,'DISGUST'),
(4,'FEAR'),
(5,'JOY'),
(6,'NEGATIVE'),
(7,'POSITIVE'),
(8,'SADNESS'),
(9,'SURPRISE'),
(10,'TRUST');


These are the sentiments available using the get_nrc_sentiment() function from the syuzhet package.

There are some much more sophisticated techniques that could be done with R and text analysis, but this is just a small taste of what can be done.

As a suggestion, I could see how doing some Topic Modeling of your comment data could lead to new dimensions you would want to incorporate into your data warehouse. Another thought is to record the timestamps of comments mad that are transcribed from a customer service call.

Does the sentiment change over time of the customer that is being helped? You would hope so.

Which one of your customer service agent consistently has the largest swing from negative to positive?
Don't know the answer to this question?

Maybe you should think about Text analytics.


Translating Textual data into data that can be used in a data warehouse is only one way of leveraging text data, but if you have powerful self service tools like Tableau, Looker, or Microstrategy, having your data in this structure makes it easy for some quick analysis on what people are thinking in the feedback they are giving to you.

Always,  when doing this type of text analysis, ensure that you have some type of business key that associates the voice of this customer to the summation of what they are saying.

Narrowing down the positive or negative comments can be invaluable for finding the needle in the haystack for the feedback you are interested in.