Pages

Showing posts with label Data Mart. Show all posts

2016-01-06

Data Management of Organic SEO

How do you manage data outside your control?


screenshot from a opensource search engine (op...
screenshot from a opensource search engine (openwebspider) (Photo credit: Wikipedia)
Search Engines are great catalogers of meta data about your web site. Recently I was asked to do a bit of SEO for a friend. I worked on putting the HTML together, and researched the topic extensively. There is a lot of almost conflicting guidance for how to do SEO for a web site. So in order to understand how SEO works, I did what I am sure many other software developers have done. I wrote my own search engine.

My search engine is anything but production grade, but the research project gave me some insight into how the big guys work. It has limitations, but rather than completely reinvent the wheel, I decided to leverage the capabilities of the tools I had.

I am sure that there are better ways to build a search engine, and this is not meant to be an authoritative methodology, but it is the way that I build my little utility to give me some insight on the process.

I used Fedora to build this, with a MySQL back end. The page crawler is all PHP code. Some of the PHP code I leveraged from the open source community. After all, the goal of this project is to understand the concepts of a search engine, not commercialize it.

The steps my crawler performed were:
1. Identify the site and the individual pages.
2. Get Links
3. Get Meta tags for document.
4. Get the raw-text
5. Get any emails from the page.
6. Clean stopwords from the raw text.
7. Do word frequency analysis on the clean raw text
8. Stem the text
9 Do word frequency analysis on the stemmed text.
10. Store readability scores.

For each of these steps, I stored the results into a database. The database would ultimately turn into a star schema for reporting purposes.

Just as an overview I will touch on each of these steps, and why I did them. Each step has plenty of documentation about it across the internet, so this is not meant to be an exhaustive explanation.

Step 1. Identify the Site and the individual pages.

    Not only would you want the individual page that a search pattern shows up on, but you also want the site associated with that page. Simple Reg-ex work here.

Step 2. Get Links.

   Parse through the HTML in order to get all of the <a> tags and record the links this page makes reference to.

Step 3. Process Meta Tags

   Record the Meta tags that the page author stored in the document. These are things like keywords, description, etc...


Step 4. Get the Raw Text.

    This step is perhaps one of the most important. Stripping out the raw text is the human readable text that people will actually read. Humans do not process HTML tags, at least normal humans anyway. HTML tags are not cataloged in my process.

Step 5. Get any emails

     Another simple reg-ex that is run against the raw text to store the emails that were embedded in the text.

Step 6. Clean stopwords.

    Stopwords are defined here: Stopwords. Basically these words are common  short function words such as the, is, and, or. These words are not very important for text scanning.

Step 7. Word frequency analysis.

    Word frequency analysis is the process of counting the word frequency of a body of text. For example in the text "The quick brown fox jumped over the slow red fox." The word "fox" would have a WFA count of two. Every other word would have a WFA "the", which would be considered a stopword in this example)

Step 8. Stem the raw text.

  Stemming is the process for reducing inflected (or sometimes derived) words to their stem, base or root form – generally a written word form, from Stemming. Why is this important? Knowing the root word of a word gives you some flexibility when it comes to processing searches. If the text from the web page is: "Fishing for red worms", and the search is "Fished for worms", if you remove the stopwords and stem both phrases you will have "Fish red worm" and "Fish worm". By doing a Like search on the database table where the keyword phrases are stored the search "Fish worm" will find "Fish red worm" and you will have a hit.

Step 9. Word Frequency Analysis on Stemmed text.

   This is step 7, only using the stemmed text instead of the raw text. 

Step 10. Store readability scores.

   A readability score like the Flesch Kincaid readability score give you the grade level of a body of text. Again, this is not an effort to explain the readability score, just a highlight that this particular score can be helpful in looking at a web site for analysis purposes.


Now that all of this was done, I produced some simple reports on the individual pages of the web site to see things like readability score, and the word frequency analysis of the pages. Funny enough, the high frequency words matched some of the keywords that google webmaster tools showed for the web-site I was working with.


2016-01-05

Data Warehouse Maturity

Not all Data Warehouse projects are created equal.


In my years of working in the data management profession, I have worked with a variety of organizations. In the last ten years or so I have worked on many projects that were all called data warehouses. Unfortunately, I can't say that any two have been alike.

Data Warehouse Overview
Data Warehouse Overview (Photo credit: Wikipedia)
Based on my experience, I can say that of all of the organizations I have worked with each fell into at least one of these categories for Data Warehouse maturity. Some organizations I have been able to take from one level to another, but it takes persistence and support from management. 


Level 0 – No formal business intelligence capabilities within the organization  

Reports are ad-hoc feeding data into local client tools managed by analysts.  Multiple people do the same work for both data extraction and report creation.  There is little cross department usage of data.  In addition, change control is not a huge priority since the majority of the analysis is ad-hoc.  The source code used to develop the reports and data transferred is not managed under a revision control system.  Queries are changed easily between runs making historical analysis difficult if not impossible. 

Level 1 – Using add-on tools supplied by vendors

This would include “built-in” data marts provided by vendors for data analytics of a particular application.  This could include, for example, SAP BW, which is a dedicated data mart solution for SAP transactions.  Even though SAP may be rather large, it is nevertheless a single data source with a predefined baseline data mart. 

Level 2 – Departmental data mart(s) with a front-end Business Intelligence tool or an Operational data store feeding common reports.  At this level, dedicated equipment for reporting and analysis is used. 

English: Datamart Architecture Pattern used Bu...
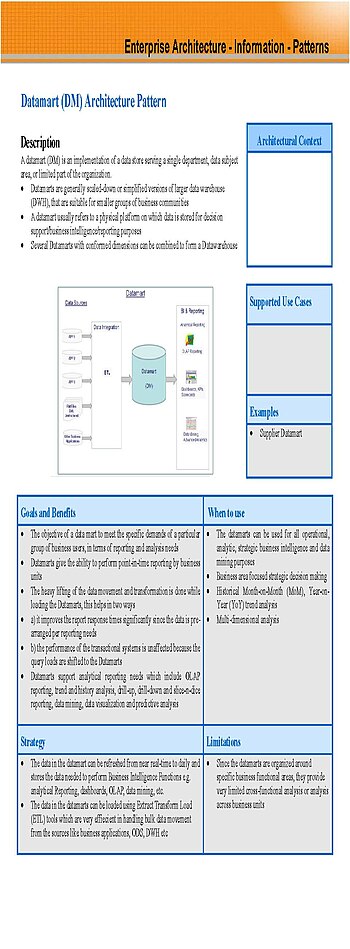
English: Datamart Architecture Pattern used Business Intelligence Reference Architecture used in conjuction with Operational Data Store and Datawarehouse. Supports Reporting , Analytics , Scorecards and Dashboard (Photo credit: Wikipedia)
Data from multiple systems integrated into a common back-end repository.  From a Kimball perspective, this is the foundation of the conformed dimension usage.  The Operational data store can be a copy of the data used by applications, but it can also be an extract of key data from the operational system to be able to provide KPI’s in a single location for multiple departments.

At this level of Data Warehouse Maturity, enough analytical and reporting queries are happening that the load needs to shift to dedicated equipment in order to reduce the load on the production systems.  Analysts will want to be looking at various scenarios that could negatively affect the native use of production applications so offloading this data and the analytical queries onto dedicated equipment becomes a priority for the organization.

This level of maturity requires, at a minimum, some dedicated technical resources to manage the infrastructure of the BI tool(s) and the job processing that controls the movement of data through the various stages that will ultimately make the data available to the BI tool.


This may not be the sole function of these personnel, but organic personnel should be managing this infrastructure.


Cross department usage of data begins here as analysts from different departments use data sourced from one or more systems into a common back-end repository.


Level 3 – ETL tool driven multiple data marts with a front-end business intelligence tool sharing sourced data with meta-data driven from ETL and data modeling tools

At this point in the growth of an organization, the volume of data moving between systems becomes large enough that sophisticated and dedicated tools becomes  a requirement to expedite the data transfer.

 Level 4 – Sophisticated “staging” area using industry best-practices (DW2.0)

A  DW2.0 integration sector called a “staging” area using Kimball terminology. The Presentation layer is generally what Kimball would call a data mart or basic dimensional model.


Level 5 –Multiple Data warehouse environments. (Large international organizations

This would be a really large organization, or one that had grown through the process of acquisitions. In the case of acquisitions, a Data Structure Graph should probably be used to keep analyze how data flows through an organization.


Why does it matter which level an organization is?  How can someone use these levels to affect their business bottom line?

Knowing how fare your organization is in this maturity process will help as you add other infrastructure like Big Data, or other systems. Also to go from one level to another is more of an incremental growth step. Each step takes a lot longer to go. From Level 0 to Level 1 takes a few weeks. From Level 1 to Level 2 takes a few months. Level 2 to 3 takes about 6 months. Level 3 to Level 4 may take up to a year to get everything complete. Level 5 is usually ongoing. Once your organization gets to Level 3 the data warehouse should be at critical mass where more and more people migrate to using it and other systems should be discontinued.


2016-01-03

The Epiphany - My first star schema

English: PNG image of a star schema
English: PNG image of a star schema (Photo credit: Wikipedia)

Dimensional Modeling


When studying new concepts there is always a moment.

A single moment when a new concept is internalized.

We don't always remember this moment, but for me, learning about the star schema concept of dimensional modeling some time ago this moment was relatively easy to remember.

It was during the election of 2004.

Up until this moment, whenever I thought of a data model it was always some sort of Normal form.

De-normalization  was not something that came naturally to me.

I had been a DBA (Database Administrator) at this point for over a decade (Let's not focus on how long I had been doing it at that point).

I had recently read The Data Warehouse Toolkit, by Ralph Kimball and Margy Ross. I was having a little difficulty applying this new found knowledge.

I was watching the election returns on the night of November 2, 2004. We had to run an errand to a car dealership that was located about 30 minutes away from home. So as we were driving, I began to play the scenario in my head asking myself this question:

How can they sum up so much diverse information so quickly?

Then I realized a few things:
  • The data had predefined structure
  • Most of the data was already known. 
  • The only thing that changed was counts. 

So I designed my first star schema driving on the I-95 corridor election night 2004.

The Geo Dimension:
Predefined:
Geo_Key, State,county,city

The Candidate Dimension:
Candidate_Key,Party,Seat,CandidateName

The Voter Dimension:
Voter_Key, VoterID,registered_party, Voter Name

The Time Dimesion:
Time_Key, Hour, Minute

Fact table (Fct_Vote):
Geo_Key,Candidate_Key,Voter_key,Time_Key,1 as vote

Using these 5 tables, I realized I could run simple queries and get all of the same numbers that the major networks were displaying.

Select State,CandidateName,sum(vote) as votes
from Fct_Vote fv
inner join Dim_Geo dg on dg.geo_key=fv.geo_key
inner join Dim_Candidate dc on dc.candidate_key=fv.candidate_Key
group by State,CandidateName

This would rollup to the overall numbers.

This is an incredibly simple example of what could be done with a dimensional model for reporting, but it shows that decoupling the structure needed for an application (Voter registration system, and actual methods used for vote counting are defined by the states, and could possibly all be different), from the structure needed for reporting and analysis can make each system efficient in its own way.

Since we also capture the time a vote takes place we can study the growth paterns, of who voted when, and did they vote along party lines:

Select dc.CandidateName,dc,party,dv.registered_party,dt.hour,sum(vote)
from Fct_Vote fv
inner join Dim_Candidate dc on dc.candidate_key=fv.candidate_Key
inner join Dim_Voter dv on dv.voter_key = fv.voter_key
group by dc.CandidateName,dc,party,dv.registered_party,dt.hour

There is another pattern emerging here:

All the queries have the same structure, since the data model has a solid predefined structure. Store this in a relational database with proper indexing, tablespace structure and decent memory and this "simple" data model can answer almost any question posed to it, cache the results to speed up future questions, and serve many users.

 This is the essence of Business Intelligence. Being able to quickly answer repeatable questions with new data.

Keep these structures the same and use your ETL process to load this structure with current data, and your report development effort becomes a question of displaying the data. As the data accumulates the same query simply shows new results.

This was one of the first steps in my journey to understanding that the structure of your data has meaning. Later on I would come to understand how to apply a Data Vault model as an integration layer before a star-schema in the presentation layer.

I continue to research this topic, and have written about my more recent application of Graph theory to both Data modeling and Enterprise Architecture in my book on Data Structure Graphs. I also write about Data Structure Graphs here on my blog

This is a great method for efficiently answering questions that are repeateable: How many widgets did we sell, based on region, quarter and store manager?

For doing statistical mining this structure may be a good starting point, but the data has to be collapsed into a single observation with all associated metrics,factors and con-founders associated with the observation for regression and other methods of non-trivial analysis.

Getting as much of your reporting data into this structure, and the supporting structures mentioned above is just a part of a Data Architecture plan.

This part is a good start, but it is only the beginning...

2015-05-27

Data-Science-or-Business-Intelligence?

Comparing Data Science and Business Intelligence


Over the past few years as I have been supporting more and more "non-traditional" (i.e. not a Data Warehouse or Data Mart) analytical platforms, I have noticed a number of differences between Data Science approaches and Business Intelligence approaches.

This image sums up many of my observations and gives a touch point for comparing the differences as well as similarities between the two approaches.


Reproducible versus Repeatable


One of the goals of #DataOps is to keep data moving to the right location in a repeatable, automatized manner. Most of the data warehouse environments I have worked on, the person doing the analysis does not run the ETL jobs. Todays data flows into existing data marts, dashboards, dimensional models, and queries that drive it all. These are repeatable processes.

Performing a Reproducible process on the other hand shows the entire process soup to nuts. The analyst pulled this data from that system, used this transformation on these data elements, combined this data with that data, ran this regression, and produced this result. Therefore if we raise the price of this widget by $.05 we will have this lift in profit (Ceteris paribus).

Predictive versus Descriptive


As described above the Data Scientist attempts to make a prediction about something, whereas the Business Intelligence analyst is usually reporting on a condition that is considered a Key Performance Indicator of the company.

Explorative versus Comparative


In most Business Intelligence environments I have worked with, the questions are usually along these lines: "Is this product selling more than that product?"

The Data Scientist would want to look at what product has the highest margin, or the product that has the largest impact on the bottom line. If someone buys product X, do they also purchase product Y?
What else is impacting this particular store? Does weather have an impact on purchase patterns? What about twitter hashtags?  What in our product line is most similar to a product that has a high purchase volume in the overall consumer community. 

Attentive versus Advocating


Data Scientist: The data shows us that consumers that purchased X also purchased Y. I suggest we relocate Y for the stores in this geographic area by 1 meter away from X, and in this geographic area they should be 2 meters away. Then we will analyze the same visit purchases for those two items to determine if this should be done in all stores.

Business Intelligence: The latest data from our campaign is shown here. The response rate among 18-24 year old males is less than what we wanted but we expect to see more lift in the coming weeks. 

Accepting versus Prescriptive


Data Scientist: Give me all data, I will analyze it as is, and determine what needs to be cleaned and what represents further opportunities. If there is a quality issue I will document it as part of the assumptions in my analysis.


Business Intelligence: The data has to be cleaned and high quality before it can be analyzed. No one should see the data before all of the quality checks, verifications, and cleansing processes are done.


Both of these approaches have business value.

I think Data Science will continue to get some press for quite a while, there will always be some amazing break through that someone used the algorithm of the day to solve a business problem. Then the performance of that algorithm will become a metric on a dashboard that is put into a data mart.

The guys and gals in #DataOps will make sure the data is current.

The Data is protected.

The Data is available.

The Data is shown on the right report to the people that are authorized to see it.

Your Data is safe. 


2011-03-02

Data Management Industry?

How important is an industry classification for data management professionals?

I have been asked  the question: What is your industry?

My reply, when given the option, is to say the Data Management Industry.

The particular vertical market that my company classifies itself according to Dun and Bradstreet Industry classification, Standard Industry Classification (SIC) or even North American Industry Classification System (NAICS) has a limited impact on my day to day duties.

Some industries have a more stringent requirement for data quality or data availability than others, but overall the manner in which data is managed between industries is consistently similar.

In every industry I have worked the same process is generally followed.

Data is captured


In Telecommunication, Energy and Supply Chain these systems are usually automated data capture via a field device such as a switch or a sensor, some are driven based on orders and some are driven based on consumer behavior.

In Retail and ECommerce the source data capture component is a customer facing system such as a web site or scanner for checking out at a grocery store.

Most companies have a human resources system that keep track of time for the customer facing employees tracking contextual information such as when did an employee arrive, what did they work on, when did they leave?

Data is integrated


Once we have the source data and as much contextual information about this data captured; that data is transferred to another system. This system could be a billing, payroll, time keeping or analytical system, such as a data warehouse or a data mart. The methods used to create this integration system can vary depending on the number of source systems involved and the requirements for cross referencing the data from one system with the data in other systems.

At times certain data points are transferred outside the organization. This data could be going to suppliers, vendors, customers or even external reporting analysts.

Internally each department within an organization needs to see certain data points. Marketing, Merchandising, Finance, Accounting, Legal, Human Resources, Billing, to name a few do not necessarily need to see all of the data captured. However the data they do require does need to get to them in a timely manner in order for these departments to support the overall organization.

Data is protected

During all of these data interchanges the same types of functions need to be performed.

Data must be secured (the users that need access have it, those that do not need access cannot see it), backed up, restores tested and verified, performance must be optimized, problems need to be addressed when they arise, quality must be maintained, and delivery must be verified.

Data Management Professionals

The Data Management profession consists of people striving to create, implement, maintain and evolve best practices for managing the data that runs our enterprise.

The challenges of data management, the problems we solve and the solutions we provide are more similar than they are different.

Is the industry classification of the enterprise we support all that important?

Enhanced by Zemanta

2011-01-30

Organic SEO Data Management

An overview of online marketing. A simple grap...Image via WikipediaHow do you manage data outside your control?

Search Engines are great catalogers of meta data about your web site. Recently I was asked to do a bit of SEO for a friend. I worked on putting the HTML together, and researched the topic of SEO extensively. There is a lot of almost conflicting guidance for how to do SEO for a web site. So in order to understand how SEO works, I did what I am sure many other software developers have done.

I wrote my own search engine.

My search engine is anything but production grade, but the research project gave me some insight into how the big guys work. It has limitations, but rather than completely reinvent the wheel, I decided to leverage the capabilities of the tools I had.

I am sure that there are better ways to build a search engine, and this is not meant to be an authoritative methodology, but it is the way that I build my little utility to give me some insight on the process.

I used Fedora to build this, with a MySQL back end. The page crawler is all PHP code. Some of the PHP code I leveraged from the open source community. After all, the goal of this project is to understand the concepts of a search engine, not commercialize it. The web pages were broken down to the raw text, that text was then analyzed and restructured into a small data mart.

The steps my crawler performed were:
1. Identify the site and the individual pages.
2. Get Links
3. Get Meta tags for document.
4. Get the raw-text
5. Get any emails from the page.
6. Clean stopwords from the raw text.
7. Do word frequency analysis on the clean raw text
8. Stem the text
9 Do word frequency analysis on the stemmed text.
10. Store readability scores.

For each of these steps, I stored the results into a database. The database would ultimately turn into a star schema data mart for reporting and analysis.

Just as an overview I will touch on each of these steps, and why I did them. Each step has plenty of documentation about it across the internet, so this is not meant to be an exhaustive explanation.

Step 1. Identify the Site and the individual pages.

    Not only would you want the individual page that a search pattern shows up on, but you also want the site associated with that page. Simple Reg-ex work here.

Step 2. Get Links.

   Parse through the HTML in order to get all of the <a> tags and record the links this page makes reference to. The goal of this step is to record the number of inbound links to a particular page. By capturing the pages this particular page links to, when we scan those pages we can do a count to see the inbound links. The biggest problem with this method is I would either have to know which sites and pages link to this page, or scan the whole internet. I chose to simply record it for internal site page link counts.

Step 3. Process Meta Tags

   Record the Meta tags that the page author stored in the document. These are things like keywords, description, etc... These keywords are the keywords that I want google to use as the keywords for this site. What I found through this research project is that these keywords do NOT necessarily match what google determines is a keyword for your site.


Step 4. Get the Raw Text.

    This step is perhaps one of the most important. Stripping out the raw text is the human readable text that people will actually read. Humans do not process HTML tags, at least normal humans anyway. HTML tags are not cataloged in my process.

Step 5. Get any emails

     Another simple reg-ex that is run against the raw text to store the emails that were embedded in the text.

Step 6. Clean stopwords.

    Stopwords are defined here: Stopwords. Basically these words are common  short function words such as the, is, and, or. These words are not very important for text scanning.

Step 7. Word frequency analysis.

    Word frequency analysis is the process of counting the word frequency of a body of text. For example in the text "The quick brown fox jumped over the slow red fox." The word "fox" would have a WFA count of two. Every other word would have a WFA "the", which would be considered a stopword in this example)

Step 8. Stem the raw text.

  Stemming is the process for reducing inflected (or sometimes derived) words to their stem, base or root form – generally a written word form, from Stemming. Why is this important? Knowing the root word of a word gives you some flexibility when it comes to processing searches. If the text from the web page is: "Fishing for red worms", and the search is "Fished for worms", if you remove the stopwords and stem both phrases you will have "Fish red worm" and "Fish worm". By doing a Like search on the database table where the keyword phrases are stored the search "Fish worm" will find "Fish red worm" and you will have a hit.

Step 9. Word Frequency Analysis on Stemmed text.

   This is step 7, only using the stemmed text instead of the raw text. 

Step 10. Store readability scores.

   A readability score like the Flesch Kincaid readability score give you the grade level of a body of text. Again, this is not an effort to explain the readability score, just a highlight that this particular score can be helpful in looking at a web site for analysis purposes.
A typical search engine results pageImage via Wikipedia

Now that all of this was done, I produced some simple reports on the individual pages of the web site to see things like readability score, and the word frequency analysis of the pages. Funny enough, the high frequency words matched some of the keywords that google webmaster tools showed for the web-site I was working with.
One thing that google analytics and webmaster tools can do for an organization is to show which pages were clicked at what time. If you were using something like this in your data warehouse, it would be interesting to see the keywords used on a particular page that sold a product, or drove a customer to make contact with your organization.

After all, if the goal of the data warehouse is to provide a 360 degree view of the customer, then wouldn't incorporating key word analytics into the data warehouse provide better insight into how the consumer interacts with the web-site, and how that interaction directly is related to sales?


Enhanced by Zemanta

2010-11-23

Data never dies

Do you ever wish you could forget something?

Certainly there are traumatic events in some of our lives that we may wish that we could forget; more often than not most people wish they could remember something.

A taste, a name, the name of a restaurant, these are all things that some of us try very hard to remember at times.

For computer data management it is a different story. I have been in many discussions where we question how far back in time we are required to retain data.

By formal definition this is called the data retention policy of an organization. There are laws in place that require certain records to be retained for 7 years. Some data must be kept indefinitely.

This simple term: “Data Retention Policy” can have an impact on software purchases, hardware purchases, man-hours and processing time for an analytics application.

Why is my application taking so long?


As the volume of data within an application grows, the performance footprint of the application will change. Things that previously ran fast will begin to run slow. I once worked for an application vendor and handled more data management issues than software development issues. On one particular occasion shortly after I started there I received a call about the application not working. Upon review of the environment where “nothing had changed” I discovered the problem. The SQL Server database was severely underpowered. Simply manually executing the SQL directly through query analyzer showed dreadful performance.

We had to recommend an upgrade in hardware. Once the customer purchased new hardware I took a team to the customer site and we did a migration of the data from the old server to the new server. When I left the site, I heard numerous people talking about how the application had not worked that well since it had been freshly installed.

A simpler answer may have been to “archive” data, to clean it out so that the performance would have returned to a fresh state or even just delete it. The reason we could not do that is that this particular application was a time tracking system for recording time-in and time-outs of employees working at a refinery. Employee data is not something that should just be purged; especially data that directly impacts how contractors and employees are paid.

The data would be studied for some time to report on cost expenditures for the site where the work was recorded.

But simply upgrading the back end database server was really only a short term solution.
This is a case where we kept all of the historical data within the application itself for reporting and study.

Reporting systems can help


As a data warehouse engineer, now I would have suggested an alternative solution. I would have suggested that “warm” data should be moved to a reporting application for reporting and study.

A threshold should be established for what is useful within an application itself for data that is pertinent and needed on a daily and weekly basis. This is the “hot” fresh data that is currently being processed. The data that is important for business continuity and reporting to auditors, vendors other business units and executives does not necessarily need to be kept within the application itself. We should have spun off a reporting system that could be used to retain that data and allow study and reporting, but not bog down the application itself.

Building specific reporting systems is essential to maintain optimal application performance. By offloading this data into an Operational Data Store, Data Mart, or Data Warehouse you will keep your “hot” data hot and fresh and your “warm” data will be available for use in an environment that does not interfere in any way with the day to day work of your business.

How long do I keep data?


How long data is kept for each business unit within an organization is a question for each business owner. Law’s need to be examined for requirements, analysts need to make it clear how much data they need to see for trending analysis, and data management personnel need to contribute to the discussion by showing alternatives for data storage, retrieval and reporting.

Keep your corporate “memory” alive by having a current data retention policy that is reviewed every time a new application is brought online. Reviewing your data retention policy at least annually keeps this issue fresh in all of the stake-holders minds. Disaster recovery planning and performance optimization both are influenced by the data retention policy.

Since the data of your company is really all of the information about your customers, vendors, suppliers, employees and holdings data never dying is a good thing!

Enhanced by Zemanta