Pages

Showing posts with label Data warehouse. Show all posts

2016-01-28

From Data Warehouse to Big Data

And now, Big Data...


Big Data has been defined as any data whose processing will not fit into a single machine.

Elephant in the St. Louis Zoo
While the assumption generally made is thinking of Hadoop and Big Data to be the same thing, many database systems I have worked on have been clustered.

Oracle, MySQL, SQL Server can all be cluster based.

While Hive is a great tool to leverage your existing SQL knowledge base, limiting your problem solving to  SQL  based access will impact the types of problems you can solve with your data.

Having been a DBA for many years, I clearly see the advantage of simply adding more machines to your cluster, and either doing a re-balance or suddenly having more space without the need for a data migration.

Early on in my career, if we were running out of space, we would have to go through a request process, then a migration downtime was undertaken to get the new space allocated to the right database.

Now, all you need to do (with Hadoop anyway) is to add another machine to the cluster.

There are some distinct similarities between a Big Data project and a data warehouse.

1) You must have a problem in mind to solve.

2) You must have executive buy in and sponsorship. Even if this is a research project you must have the resources to actually build your cluster, then move data onto the cluster.

3) The data must be organized. This will probably not be a normalization scheme like we saw previously from Codd. You should place similar data near each other. (Logs should be organized in folders for logs, RDBMS extracts should be organized in folders named in a similar manner to the original system schemas.)

There is lots of room for innovation, and application of best practices from non hadoop based structures.

But some guidelines should be followed.  These guidelines should be consistent with the rest of your data architecture.

Otherwise things will fall into disarray quickly indeed.

One way to organize the movement of data into your data lake, as well as were the summary data goes later is to use a Data Structure Graph  this will also help you with the rest of your data architecture.
I could go into lots of details about how to set up a Hadoop cluster, but things evolve quickly in that space, and I am sure anything I write would be outdated quickly.

I encourage you to look for a practice VM to work with like : the cloudera quick start VM


Practice, try new things, then move them to production. If you need help, reach out, there are many sources to find good advice for setting up your hadoop environment.


2016-01-23

Melvil Dewey - The first Data Architect

English: From left to right: R. R. Bowker, Mrs...
English: From left to right: R. R. Bowker, Mrs. Dewey and Melvil Dewey (Photo credit: Wikipedia)

What is a data Architect?


Let us start with understanding a basic definition of an application architect.

java Architects know the ins and outs of Java, the versions, the capabilities, the tools, the memory requirements, etc...

A Data Architect on the other hand has a detailed understanding of the impact of how data is organized.

All of the traditional normalization rules to which we owe Ted Codd , not to mention all of the denormalized usage patterns that Ralph Kimball wrote about.

Staging areas, ETL processes, the impact of the various RAID levels on performance. Which Data center which data should be copied to, how to do sharding on a relational system.

Basically, Data Architects do not write the original software that produces the data, but they know how the data should be organized in that application, as well as what to do with the data once it leaves the original application repository for use-cases the application developers did not envision.

Melvil Dewey was not an author.

However, he did more to allow people to have access to books, and be able to find books that were related to topics they were interested in than any other person.

Today with our Data Lakes, Data Warehouses, Spark Clusters, Hadoop Clusters, Data Marts, Data Scientists, and Data Analysts all trying to pull data together, organize it, channel it, and transform this raw data into business value.

We should remember the simple approach that Dewey took.

Know where your data is located.

Organize the data to make it easy for others to both use and find.

Categorize your data in a manner that makes sense to the most amount of people.

His method is not perfect, and some improvement has been made in the way data is organized, cataloged and searched for. But his methods stood the test of time for many years until later inventions were able to use newer methods to find and access data.

Will your architecture stand for more than a hundred years?

Will it survive the next CIO that takes over?

How much thought is given to the organization of the data within your organization, and how the various needs of different systems are met?

Do you use a Data Structure Graph  to keep track of the importance of the various data feeds that are the life-blood of your organization?

How do you organize your data?


2016-01-08

Which ETL did you write?

What is your ETL (Historical, or daily)?


ETL processes are one of the most important processes for any data warehouse project.
English: ETL job design
English: ETL job design (Photo credit: Wikipedia)

In non-technical terms and ETL process is a method of moving data from one place to another and prepare it for use in the second location.

Extract

    Pull data from a location

Transform

    This transformation could be any number of things. Transform epoch time to a human readable form.

Load

    Load this transformed data into it's next destination.


ETL can be as simple as a single SQL script, it could be as complicated as a workflow in Informatica, Pentaho, or other ETL tools.

ETL processes are not the only mechanism for moving data within the enterprise. An alternative is a service. However, services are not ETL. A service request gives a point in-time snapshot of a small set of data specifically related to the parameters that call the service. A good tool for understanding all of the data flows throughout your organization is to create a  Data Structure Graph including ETL, FTP, web-services, and ESB applications as nodes on your graph.

ETL historically has been an extract of a large data set, or table from one repository, then transform it or even restructure the data, then load it into some type of table.

Generally this process goes like this:
Source System -> Staging Area -> Final Destination.

In data warehouse terminology this staging area is volatile, and refreshed with new data before loading into some final structure.

Funny enough some Big Data projects follow this same methodology. Pull data from a source system, do some transformations on the data, then store it in a final location for consumption by your users.

This is not the Data Science portion of a big data project.  I will write more about data science in a later article, for now here is where I talk about the difference between Data Science and Business Intelligence

For any process where data is extracted from a source system, there should be two different methods of extraction. The Daily process, and the historical process.

The daily process is usually quite simple, just grab all the data from a particular table, that has been created or updated since the last extract.

The historical process eliminates the timestamp requirement.

This sounds simple.

Generally it is, however, I have seen on more than one occasion the "full-historical" data behaves quite differently from the "daily" snapshot.

This is due to the fact that the daily process is usually designed to handle small quantities of data, whereas if you do a full historical process the behavior is quite different.

A daily process may or may not scale when dealing with larger volumes than it normally does. 

Do not assume that daily processes can handle the same volume. Also, there have been times where a quality problem goes unnoticed for some period of time, then when found a full historical refresh of the data warehouse was required. We did the math, and determined that running 2 years worth of daily extract and load processes would take 3 weeks. If we used a different process we could get it done in 48 hours.

The processes are optimized for different workloads. Keep this in mind when you design future ETL work.


2016-01-05

Data Warehouse Maturity

Not all Data Warehouse projects are created equal.


In my years of working in the data management profession, I have worked with a variety of organizations. In the last ten years or so I have worked on many projects that were all called data warehouses. Unfortunately, I can't say that any two have been alike.

Data Warehouse Overview
Data Warehouse Overview (Photo credit: Wikipedia)
Based on my experience, I can say that of all of the organizations I have worked with each fell into at least one of these categories for Data Warehouse maturity. Some organizations I have been able to take from one level to another, but it takes persistence and support from management. 


Level 0 – No formal business intelligence capabilities within the organization  

Reports are ad-hoc feeding data into local client tools managed by analysts.  Multiple people do the same work for both data extraction and report creation.  There is little cross department usage of data.  In addition, change control is not a huge priority since the majority of the analysis is ad-hoc.  The source code used to develop the reports and data transferred is not managed under a revision control system.  Queries are changed easily between runs making historical analysis difficult if not impossible. 

Level 1 – Using add-on tools supplied by vendors

This would include “built-in” data marts provided by vendors for data analytics of a particular application.  This could include, for example, SAP BW, which is a dedicated data mart solution for SAP transactions.  Even though SAP may be rather large, it is nevertheless a single data source with a predefined baseline data mart. 

Level 2 – Departmental data mart(s) with a front-end Business Intelligence tool or an Operational data store feeding common reports.  At this level, dedicated equipment for reporting and analysis is used. 

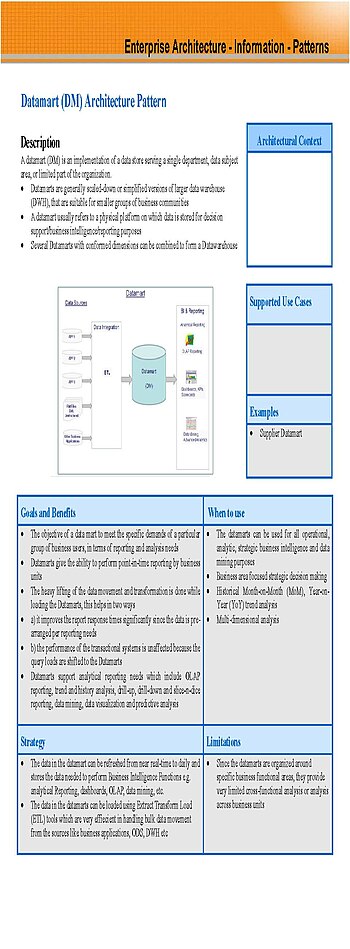
English: Datamart Architecture Pattern used Bu...
English: Datamart Architecture Pattern used Business Intelligence Reference Architecture used in conjuction with Operational Data Store and Datawarehouse. Supports Reporting , Analytics , Scorecards and Dashboard (Photo credit: Wikipedia)
Data from multiple systems integrated into a common back-end repository.  From a Kimball perspective, this is the foundation of the conformed dimension usage.  The Operational data store can be a copy of the data used by applications, but it can also be an extract of key data from the operational system to be able to provide KPI’s in a single location for multiple departments.

At this level of Data Warehouse Maturity, enough analytical and reporting queries are happening that the load needs to shift to dedicated equipment in order to reduce the load on the production systems.  Analysts will want to be looking at various scenarios that could negatively affect the native use of production applications so offloading this data and the analytical queries onto dedicated equipment becomes a priority for the organization.

This level of maturity requires, at a minimum, some dedicated technical resources to manage the infrastructure of the BI tool(s) and the job processing that controls the movement of data through the various stages that will ultimately make the data available to the BI tool.


This may not be the sole function of these personnel, but organic personnel should be managing this infrastructure.


Cross department usage of data begins here as analysts from different departments use data sourced from one or more systems into a common back-end repository.


Level 3 – ETL tool driven multiple data marts with a front-end business intelligence tool sharing sourced data with meta-data driven from ETL and data modeling tools

At this point in the growth of an organization, the volume of data moving between systems becomes large enough that sophisticated and dedicated tools becomes  a requirement to expedite the data transfer.

 Level 4 – Sophisticated “staging” area using industry best-practices (DW2.0)

A  DW2.0 integration sector called a “staging” area using Kimball terminology. The Presentation layer is generally what Kimball would call a data mart or basic dimensional model.


Level 5 –Multiple Data warehouse environments. (Large international organizations

This would be a really large organization, or one that had grown through the process of acquisitions. In the case of acquisitions, a Data Structure Graph should probably be used to keep analyze how data flows through an organization.


Why does it matter which level an organization is?  How can someone use these levels to affect their business bottom line?

Knowing how fare your organization is in this maturity process will help as you add other infrastructure like Big Data, or other systems. Also to go from one level to another is more of an incremental growth step. Each step takes a lot longer to go. From Level 0 to Level 1 takes a few weeks. From Level 1 to Level 2 takes a few months. Level 2 to 3 takes about 6 months. Level 3 to Level 4 may take up to a year to get everything complete. Level 5 is usually ongoing. Once your organization gets to Level 3 the data warehouse should be at critical mass where more and more people migrate to using it and other systems should be discontinued.


2016-01-03

The Epiphany - My first star schema

English: PNG image of a star schema
English: PNG image of a star schema (Photo credit: Wikipedia)

Dimensional Modeling


When studying new concepts there is always a moment.

A single moment when a new concept is internalized.

We don't always remember this moment, but for me, learning about the star schema concept of dimensional modeling some time ago this moment was relatively easy to remember.

It was during the election of 2004.

Up until this moment, whenever I thought of a data model it was always some sort of Normal form.

De-normalization  was not something that came naturally to me.

I had been a DBA (Database Administrator) at this point for over a decade (Let's not focus on how long I had been doing it at that point).

I had recently read The Data Warehouse Toolkit, by Ralph Kimball and Margy Ross. I was having a little difficulty applying this new found knowledge.

I was watching the election returns on the night of November 2, 2004. We had to run an errand to a car dealership that was located about 30 minutes away from home. So as we were driving, I began to play the scenario in my head asking myself this question:

How can they sum up so much diverse information so quickly?

Then I realized a few things:
  • The data had predefined structure
  • Most of the data was already known. 
  • The only thing that changed was counts. 

So I designed my first star schema driving on the I-95 corridor election night 2004.

The Geo Dimension:
Predefined:
Geo_Key, State,county,city

The Candidate Dimension:
Candidate_Key,Party,Seat,CandidateName

The Voter Dimension:
Voter_Key, VoterID,registered_party, Voter Name

The Time Dimesion:
Time_Key, Hour, Minute

Fact table (Fct_Vote):
Geo_Key,Candidate_Key,Voter_key,Time_Key,1 as vote

Using these 5 tables, I realized I could run simple queries and get all of the same numbers that the major networks were displaying.

Select State,CandidateName,sum(vote) as votes
from Fct_Vote fv
inner join Dim_Geo dg on dg.geo_key=fv.geo_key
inner join Dim_Candidate dc on dc.candidate_key=fv.candidate_Key
group by State,CandidateName

This would rollup to the overall numbers.

This is an incredibly simple example of what could be done with a dimensional model for reporting, but it shows that decoupling the structure needed for an application (Voter registration system, and actual methods used for vote counting are defined by the states, and could possibly all be different), from the structure needed for reporting and analysis can make each system efficient in its own way.

Since we also capture the time a vote takes place we can study the growth paterns, of who voted when, and did they vote along party lines:

Select dc.CandidateName,dc,party,dv.registered_party,dt.hour,sum(vote)
from Fct_Vote fv
inner join Dim_Candidate dc on dc.candidate_key=fv.candidate_Key
inner join Dim_Voter dv on dv.voter_key = fv.voter_key
group by dc.CandidateName,dc,party,dv.registered_party,dt.hour

There is another pattern emerging here:

All the queries have the same structure, since the data model has a solid predefined structure. Store this in a relational database with proper indexing, tablespace structure and decent memory and this "simple" data model can answer almost any question posed to it, cache the results to speed up future questions, and serve many users.

 This is the essence of Business Intelligence. Being able to quickly answer repeatable questions with new data.

Keep these structures the same and use your ETL process to load this structure with current data, and your report development effort becomes a question of displaying the data. As the data accumulates the same query simply shows new results.

This was one of the first steps in my journey to understanding that the structure of your data has meaning. Later on I would come to understand how to apply a Data Vault model as an integration layer before a star-schema in the presentation layer.

I continue to research this topic, and have written about my more recent application of Graph theory to both Data modeling and Enterprise Architecture in my book on Data Structure Graphs. I also write about Data Structure Graphs here on my blog

This is a great method for efficiently answering questions that are repeateable: How many widgets did we sell, based on region, quarter and store manager?

For doing statistical mining this structure may be a good starting point, but the data has to be collapsed into a single observation with all associated metrics,factors and con-founders associated with the observation for regression and other methods of non-trivial analysis.

Getting as much of your reporting data into this structure, and the supporting structures mentioned above is just a part of a Data Architecture plan.

This part is a good start, but it is only the beginning...

2014-03-28

Databases-are-pack-mules-neither-cattle-nor-puppies

"Treat your servers like Cattle, not puppies" is  mantra I have heard repeatedly in a former engagement where I was actively involved in deploying a cloud based solution with RightScale across Rackspace, AWS, and Azure.

The idea is that if you have a problem with a particular server, simply kill it, relaunch it with the appropriate rebuild scripts like chef and some other automation, have it reconnect to the load balancer and you are off to the races.


I think there is one significant flaw in this philosophy.

Database servers, or data servers are neither Cattle nor puppies. They are however like Pack Mules.

If you have an issue with some data servers like Cassandra have some built in rebalancing capabilities that allow you to kill one particular instance of a Cassandra ring, bring up a new one, and it will redistribute the loads of data you may have. Traditional database engines like SQL Server, Oracle, MySQL, etc... do not have this built in capability.

Backups still need to be done, Restores still need to be tested, bringing up a new relational database server requires a bit of expertise to get it right. There is still plenty of room for automation, scripting, and other capabilities.

That being said, database infrastructure needs to have a trained, competent, database administrator overseeing its care and maintenance.

We have all seen movies where pack mules were carrying supplies of the adventurers. 

As you take a Pack Mule on your adventures or explorations with you, if it breaks its leg, you can get a new pack pule easy enough. However, you have to remove all of the things that the pack mule was carrying to the new pack mule. If you don't have a new pack mule, or can't get one quickly the adventurers themselves have to carry the supplies, the load is redistributed, priorities of what is truly needed to make it through the foreseeable next steps, and plans are made to find the local town to get a new pack mule.

Back in the present database infrastructure is truly the lifeblood of all of our organizations. Trying to "limp" through, or simply "blow away" our servers and rebuilding them is an extreme philosophy. There are laws, regulations, and customer agreements regarding the treatment and protection of data that must be adhered to.

Who is taking care of your pack mules? Will your current pack mule make it over the next hill you have to climb?


Enhanced by Zemanta

2011-05-27

Analytical Skills?

One particular skill listed on many job descriptions I have seen gives me more questions than answers.

The skill they would like the candidate to have is listed as : Analytical Skills


How is this quantified? How do you know that someone has analytical skills?


Wiki defines Analysis as the ability to break down a complex topic or substance into smaller parts to gain a better understanding of it.

To what level of detail does this particular job need Analytical Skills? Will the candidate need to analyze the Enterprise accounting functions? Does it need to be the analysis of the physical server infrastructure? Does it need to be organizational layout? Will the candidate be analyzing forensic evidence?

Analytical skill is such a broad topic, and once a person does their analysis what happens to it? Is this a position that has the ability to not just analyze data, but also act on it? Is the analysis required in the position for recommendation purposes, educational purposes, or will the candidate be making decisions based on data provided by others?

Many people have analytical skills, but do they have good analytical skills? Do decision makers listen to and follow their recommendations after an analysis is done?

Data Management professionals are constantly analyzing data. The raw data can represent many diverse topics. Some of the key topics for analysis that come to mind are People, Processes and Things.

People

The analysis of people, their motivations, and their interactions is covered by subjects like anthropology, psychology, sociology and other behavioral sciences. Some people are naturally gifted people readers and can understand others with limited formal training. The analysis of people is useful to many groups within an organization, human resources, marketing, sales, even executive leadership.

Process

There are many types of processes in our lives, a process for getting a drivers license, getting married, fulfilling a product order, shipping a product, and many others. Understanding and recommending improvements to the nature of the processes that we interact with on a daily basis can be very valuable.

Things


Things can be companies, human languages, computer languages, web pages, corporate ledgers, computers, cars, religions, money, inventories, nature. Every "thing" can be studied and analyzed. The more we understand things the more data we generate about those things in order to contribute to human knowledge, self knowledge or our corporate enterprise.

Data

All things that are analyzed have one thing in common. Data. In all analysis data is what is collected, stored, manipulated, reported, recommended and decided upon.

There are best-practices for data management that can assist every type of analysis of every subject. "Pure" analytical skill is seldom used in a vacuum. Databases store data, operational systems collect data, a data warehouse helps in the correlation of data amongst multiple systems that are gathering data. Data Management by its very nature is an analytical skill.

When I see a position for a data management professional that requires analytical skills, I still find it humorous. Because the analytical skills that we can provide in both our own analysis and in guiding the analysis of others should go without saying.
Enhanced by Zemanta

2011-03-02

Data Management Industry?

How important is an industry classification for data management professionals?

I have been asked  the question: What is your industry?

My reply, when given the option, is to say the Data Management Industry.

The particular vertical market that my company classifies itself according to Dun and Bradstreet Industry classification, Standard Industry Classification (SIC) or even North American Industry Classification System (NAICS) has a limited impact on my day to day duties.

Some industries have a more stringent requirement for data quality or data availability than others, but overall the manner in which data is managed between industries is consistently similar.

In every industry I have worked the same process is generally followed.

Data is captured


In Telecommunication, Energy and Supply Chain these systems are usually automated data capture via a field device such as a switch or a sensor, some are driven based on orders and some are driven based on consumer behavior.

In Retail and ECommerce the source data capture component is a customer facing system such as a web site or scanner for checking out at a grocery store.

Most companies have a human resources system that keep track of time for the customer facing employees tracking contextual information such as when did an employee arrive, what did they work on, when did they leave?

Data is integrated


Once we have the source data and as much contextual information about this data captured; that data is transferred to another system. This system could be a billing, payroll, time keeping or analytical system, such as a data warehouse or a data mart. The methods used to create this integration system can vary depending on the number of source systems involved and the requirements for cross referencing the data from one system with the data in other systems.

At times certain data points are transferred outside the organization. This data could be going to suppliers, vendors, customers or even external reporting analysts.

Internally each department within an organization needs to see certain data points. Marketing, Merchandising, Finance, Accounting, Legal, Human Resources, Billing, to name a few do not necessarily need to see all of the data captured. However the data they do require does need to get to them in a timely manner in order for these departments to support the overall organization.

Data is protected

During all of these data interchanges the same types of functions need to be performed.

Data must be secured (the users that need access have it, those that do not need access cannot see it), backed up, restores tested and verified, performance must be optimized, problems need to be addressed when they arise, quality must be maintained, and delivery must be verified.

Data Management Professionals

The Data Management profession consists of people striving to create, implement, maintain and evolve best practices for managing the data that runs our enterprise.

The challenges of data management, the problems we solve and the solutions we provide are more similar than they are different.

Is the industry classification of the enterprise we support all that important?

Enhanced by Zemanta

2011-02-17

Thought leadership

You have to be a thought leader in order to recognize one.

I hear the term thought leader bestowed upon people occasionally. I have even bestowed this term on some people that I consider to be extremely knowledgeable about building data warehouse systems.

The wealth of information for data management best practices continues to grow. Thought leaders can publish knowledge about solving a particular problem in a variety of forums now: blogs, books, articles, and even research papers. The sheer volume of information about the "best practices" is almost intimidating.

The ability to take in all of the information about best practices for a subject area, apply it to the situation at hand, consolidating the recommendations from multiple sources as well as ignoring those recommendations that are not applicable make you a thought leader. Google provides a way of finding a site that answers a particular question. If a person does not ask the correct question, Google does not provide a good answer. Once Google finds a particular answer to a keyword query you have to apply that answer to your particular situation.

Let us take a specific example.

The question should not be:

What is the best way to build A data warehouse?

The question should be:

What is the best way to build THIS data warehouse?

Even something as simple as learning a how to apply a new SQL trick that you learned to a specific problem you are working on shows the application of this knowledge. Best practices can be abstract, or even theoretical. When you can take recommendations from many sources and apply their expertise to your specific problem you have taken a big step.

This can apply to many other professional areas.  SEO, Business Analysis, Business Process Re-engineering, ETL development,Resume writing, Financial Analysis, Online Marketing,  etc...


If you can study multiple sources and apply their recommendations or findings to your own situation, you become a thought leader.

You become a recognized thought leader when you write about it. 


Enhanced by Zemanta

2011-02-15

When is the Data Warehouse Done?

Is  Data Warehouse development ever complete?

During the launch of a data warehouse project  There are schedules and milestones published for everyone to mark on their calendar. A good portion of these milestones are met, the data model is reviewed, development is done, data is loaded, dashboards are created, reports generated and the users are happy right?

Data Warehouse OverviewImage via Wikipedia
Well, one would hope.
Invariably there is always one more question. How hard would it be to add this metric?

Sometimes it is just a matter of spinning out a new report, new dashboard or even new report. Sometimes the question comes requiring data from an application that did not even exist when the data warehouse project was started. Now the architect has to go back and do integration work to incorporate the data source into the data warehouse, perhaps new modeling needs to be done, perhaps this requires some time for ETL development, sometimes it is just some front end business intelligence work that needs to be done.

Once that is deployed does the data warehouse answer all questions for the enterprise? Can the project then be said to be complete, done and over?

I think perhaps not.

Most data warehouse projects I have worked on have been released in phases. Once a phase is done and users are happy with it we move on to the next phase. Occasionally we have to go back and modify, for various reasons, things that we have already completed and put into production. Is it ever complete? Is it ever done?

I think a data warehouse requires no more modifications in only one case.

When the company no longer exists.

So long as the enterprise is vibrant and interacting with customers, suppliers, vendors and the like. So long as data comes in and goes out of the organization development of the data warehouse will need to continue. It may not be as intense as at the beginning of the original project, but development will need to be done.

So long as the enterprise lives, the data warehouse lives and changes.


Enhanced by Zemanta

2011-02-11

Dynamic Situational Awareness and Multi Agent Systems

I just watched the exultation of the people of Egypt after the announcement that Hosni Mubarak relinquished the Presidency of Egypt to the Military. Egypt's revolution represents many things to many people, and analysts, historians, economists and others will be analyzing the cause, and the events that took place throughout the revolution for some time. The story is just beginning.

One thing that this reminded me of is a model I studied some time ago.

Multi agentImage via WikipediaThe concept of Multi Agent Systems, is a system composed of multiple interacting intelligent agents. Multi-agent systems can be used to solve problems which are difficult or impossible for an individual agent or monolithic system to solve. Borrowing from the definition is an overview:

Overview

The agents in a multi-agent system have several important characteristics:[4]
  • Autonomy: the agents are at least partially autonomous
  • Local views: no agent has a full global view of the system, or the system is too complex for an agent to make practical use of such knowledge
  • Decentralization: there is no designated controlling agent (or the system is effectively reduced to a monolithic system)[5]
Typically multi-agent systems research refers to software agents. However, the agents in a multi-agent system could equally well be robots,[6] humans or human teams. A multi-agent system may contain combined human-agent teams.

What we as a community have seen is an example of a multi agent system that breaks one of these rules.

The rule of "Local views" did not apply to the crowd of people in Egypt. Thanks to Twitter, Facebook, Youtube and cell phones each person had access to the global view. Some examples of this is called: Situational Awareness

The new social media tools available to the communities of people in Egypt allowed them to have full situational awareness of their local environment as well as the environment in the country as a whole. Modeling this behavior will be something that I am sure many researchers will be working on for some time to come.

How will we see some of this translated into the business world? Dashboards, Mobile Business Intelligence based on clean, concise data systems that are fed from data warehouses or data marts can profoundly impact the capabilities of the people that use these systems. Quickly getting appropriate data to the appropriate person can completely change the ability of business analysts, financial planners, buyers, sellers, accountants and managers to do their daily jobs.

When faced with the questions of how can delivery of data quickly to intelligence systems impact the bottom line. The behavior of the people of Egypt shows how quick access to information can have an impact on an environment.

I hope that the people of Egypt build a stronger country and live in peace with their neighbors and the rest of the world. Peace loving people around the world congratulate you.


Enhanced by Zemanta

2011-02-04

What's your most profitable cupcake?

Intuit has a commercial about a small business owner wondering whether they should make more cookies and cream cupcakes.

Intuit's Cupcake commercial

In the commercial, a store owner says to a guy behind a  computer, "I've been thinking about doing more cookies and cream cupcakes."
Close-up of cupcake with pink frosting and spr...Image via Wikipedia
The go replies, "Oh well let's see what the data says."
A screen pops up with a chart, that shows growing numbers from left to right, and the computer guy looks around to see others in the computer room eating cookies and cream cupcakes.

The commercial then talks about how intuit small business software takes care of all of your data for you.

I have never used Intuit software, but I have built a number of data warehouse systems. A data warehouse is the foundation of a business intelligence solution that this commercial represents.

For small businesses, I am sure it is possible to look into a single application to get the answers to the implied question of the business owner in this commercial. The implied question, of course, is: What is my best selling cupcake?

But what if that question changed just a little bit? What if the question was: What is my most profitable cupcake?

To determine profitability takes a bit more data than just determining the best selling. If you sell 1000 types of cupcakes, but the profit margin is $.05 per cupcake, then you just made $50.00. If you have another type of cupcake that has a profit margin of $.25 per cupcake then you only have to sell 200 to make the same amount of money. In order to calculate this, you need to take into account the cost of the supplies and manpower required to make the cupcake.

Another question that comes to mind is: What is my second or even third best selling cupcakes? If someone buys the number 1 cupcake, what else do they buy? Can I give an incentive for customers to come in and buy my 2nd best selling cupcake, but once they are in the store upsell them to the other cupcakes available? This topic is really called market basket analysis, which is more than I intend to cover in this article.

Which supplier that provides the raw material for the cupcakes is the best? How do you determine the best supplier? Is it the price of the raw material? How many times has the delivery truck been late? Do you have alternative suppliers just in case there is a problem with your main supplier?  What are the questions that are important to you in making these decisions?

Which employee makes the most cupcakes? Which employee makes the most profitable cupcake? Are they the same person? How do you know?

What happens when this store owner gets more than one store? If she is able to buy an existing store, will the new store have the same application? How will the data be integrated to be able to answer "simple" questions like the question posed above?

For some small business a single application may meet all of your needs. When things start to grow, as most small business owners want them to, having a data management strategy becomes a strategic priority. The rate at which data can grow for small business owners today can cause things to become complicated very quickly. The questions that are asked about your business will change over time, and data may need to come from more than one application to answer the questions of a growing business.

Do you know if you are asking the right questions for your business? Do you know if the data you are relying on to answer those questions is the coming from the correct application? What factors should be influencing your decisions that may not be represented in the "off the shelf" application?

How do you determine which cupcakes to make?


Enhanced by Zemanta

2011-01-30

Organic SEO Data Management

An overview of online marketing. A simple grap...Image via WikipediaHow do you manage data outside your control?

Search Engines are great catalogers of meta data about your web site. Recently I was asked to do a bit of SEO for a friend. I worked on putting the HTML together, and researched the topic of SEO extensively. There is a lot of almost conflicting guidance for how to do SEO for a web site. So in order to understand how SEO works, I did what I am sure many other software developers have done.

I wrote my own search engine.

My search engine is anything but production grade, but the research project gave me some insight into how the big guys work. It has limitations, but rather than completely reinvent the wheel, I decided to leverage the capabilities of the tools I had.

I am sure that there are better ways to build a search engine, and this is not meant to be an authoritative methodology, but it is the way that I build my little utility to give me some insight on the process.

I used Fedora to build this, with a MySQL back end. The page crawler is all PHP code. Some of the PHP code I leveraged from the open source community. After all, the goal of this project is to understand the concepts of a search engine, not commercialize it. The web pages were broken down to the raw text, that text was then analyzed and restructured into a small data mart.

The steps my crawler performed were:
1. Identify the site and the individual pages.
2. Get Links
3. Get Meta tags for document.
4. Get the raw-text
5. Get any emails from the page.
6. Clean stopwords from the raw text.
7. Do word frequency analysis on the clean raw text
8. Stem the text
9 Do word frequency analysis on the stemmed text.
10. Store readability scores.

For each of these steps, I stored the results into a database. The database would ultimately turn into a star schema data mart for reporting and analysis.

Just as an overview I will touch on each of these steps, and why I did them. Each step has plenty of documentation about it across the internet, so this is not meant to be an exhaustive explanation.

Step 1. Identify the Site and the individual pages.

    Not only would you want the individual page that a search pattern shows up on, but you also want the site associated with that page. Simple Reg-ex work here.

Step 2. Get Links.

   Parse through the HTML in order to get all of the <a> tags and record the links this page makes reference to. The goal of this step is to record the number of inbound links to a particular page. By capturing the pages this particular page links to, when we scan those pages we can do a count to see the inbound links. The biggest problem with this method is I would either have to know which sites and pages link to this page, or scan the whole internet. I chose to simply record it for internal site page link counts.

Step 3. Process Meta Tags

   Record the Meta tags that the page author stored in the document. These are things like keywords, description, etc... These keywords are the keywords that I want google to use as the keywords for this site. What I found through this research project is that these keywords do NOT necessarily match what google determines is a keyword for your site.


Step 4. Get the Raw Text.

    This step is perhaps one of the most important. Stripping out the raw text is the human readable text that people will actually read. Humans do not process HTML tags, at least normal humans anyway. HTML tags are not cataloged in my process.

Step 5. Get any emails

     Another simple reg-ex that is run against the raw text to store the emails that were embedded in the text.

Step 6. Clean stopwords.

    Stopwords are defined here: Stopwords. Basically these words are common  short function words such as the, is, and, or. These words are not very important for text scanning.

Step 7. Word frequency analysis.

    Word frequency analysis is the process of counting the word frequency of a body of text. For example in the text "The quick brown fox jumped over the slow red fox." The word "fox" would have a WFA count of two. Every other word would have a WFA "the", which would be considered a stopword in this example)

Step 8. Stem the raw text.

  Stemming is the process for reducing inflected (or sometimes derived) words to their stem, base or root form – generally a written word form, from Stemming. Why is this important? Knowing the root word of a word gives you some flexibility when it comes to processing searches. If the text from the web page is: "Fishing for red worms", and the search is "Fished for worms", if you remove the stopwords and stem both phrases you will have "Fish red worm" and "Fish worm". By doing a Like search on the database table where the keyword phrases are stored the search "Fish worm" will find "Fish red worm" and you will have a hit.

Step 9. Word Frequency Analysis on Stemmed text.

   This is step 7, only using the stemmed text instead of the raw text. 

Step 10. Store readability scores.

   A readability score like the Flesch Kincaid readability score give you the grade level of a body of text. Again, this is not an effort to explain the readability score, just a highlight that this particular score can be helpful in looking at a web site for analysis purposes.
A typical search engine results pageImage via Wikipedia

Now that all of this was done, I produced some simple reports on the individual pages of the web site to see things like readability score, and the word frequency analysis of the pages. Funny enough, the high frequency words matched some of the keywords that google webmaster tools showed for the web-site I was working with.

One thing that google analytics and webmaster tools can do for an organization is to show which pages were clicked at what time. If you were using something like this in your data warehouse, it would be interesting to see the keywords used on a particular page that sold a product, or drove a customer to make contact with your organization.

After all, if the goal of the data warehouse is to provide a 360 degree view of the customer, then wouldn't incorporating key word analytics into the data warehouse provide better insight into how the consumer interacts with the web-site, and how that interaction directly is related to sales?


Enhanced by Zemanta