 |
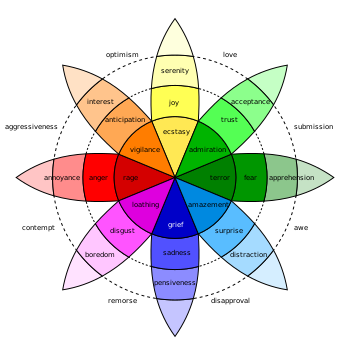
| English: Robert Plutchik's Wheel of Emotions (Photo credit: Wikipedia) |
There was a question in the audience about trying some of these text techniques ourselves, is there anything he could teach us.
The answer was less that satisfying to a do it yourself-er like some of us in the audience.
I have had some reason to do basic sentiment analysis at work recently and I was really looking forward to his talk.
Since the question was raised about how to get started in this area without totally going overboard, I will share some of my experiences.
I use R and SQL for the majority of my work, so the sentiment work will be some basic R code.
If there is some interest, please post a comment, and I will add this to my github for sharing.
Here is a small sample for doing sentiment:
# Get sentiment on the comments of the source data set
sentiment_data <- get_nrc_sentiment(as.character(source_data_frame$Comments))
# Transpose rows to columns
transposed_sentiment_data<-data.frame(t(sentiment_data))
# Summarize the data so we have a single row per sentiment.
transposed_sentiment_data_summary <- data.frame(rowSums(td[1:length(transposed_sentiment_data)]))
# change the name of the result set
names(transposed_sentiment_data_summary)[1] <- "count"
transposed_sentiment_data_summary <- cbind("sentiment" = rownames(transposed_sentiment_data_summary), transposed_sentiment_data_summary)
rownames(transposed_sentiment_data_summary) <- NULL
# only get the emotional data into the subset.
subset_sentiment_data<-transposed_sentiment_data_summary[1:8,]
# display a quick plot
qplot(sentiment, data=subset_sentiment_data, weight=count,fill=sentiment) +ggtitle(plot_title)
# display a plot that is just positive or negative data.
qplot(sentiment, data=transposed_sentiment_data_summary[9:10,],weight=count,fill=sentiment)+ggtitle('Positive/Negative')
So long as your source data set has some business key stored in it, this data frame can be written out to a data base (I use snowflake), as a staging table, that is then transformed to a Fact table.
I created a small dimension table for sentiment like this:
INSERT INTO dim_sentiment VALUES
(1,'ANGER'),
(2,'ANTICIPATION'),
(3,'DISGUST'),
(4,'FEAR'),
(5,'JOY'),
(6,'NEGATIVE'),
(7,'POSITIVE'),
(8,'SADNESS'),
(9,'SURPRISE'),
(10,'TRUST');
These are the sentiments available using the get_nrc_sentiment() function from the syuzhet package.
There are some much more sophisticated techniques that could be done with R and text analysis, but this is just a small taste of what can be done.
As a suggestion, I could see how doing some Topic Modeling of your comment data could lead to new dimensions you would want to incorporate into your data warehouse. Another thought is to record the timestamps of comments mad that are transcribed from a customer service call.
Does the sentiment change over time of the customer that is being helped? You would hope so.
Which one of your customer service agent consistently has the largest swing from negative to positive?
Don't know the answer to this question?
Maybe you should think about Text analytics.
Translating Textual data into data that can be used in a data warehouse is only one way of leveraging text data, but if you have powerful self service tools like Tableau, Looker, or Microstrategy, having your data in this structure makes it easy for some quick analysis on what people are thinking in the feedback they are giving to you.
Always, when doing this type of text analysis, ensure that you have some type of business key that associates the voice of this customer to the summation of what they are saying.
Narrowing down the positive or negative comments can be invaluable for finding the needle in the haystack for the feedback you are interested in.


Great post!
ReplyDeleteThanks for sharing this list!
It helps me a lot finding a relevant blog in my niche!
tableau training
tableau course