Graphs are everywhere.
This is a phrase that I have heard many times, especially
coming from the Neo4J community. The more I study Graphs, the more I see ways
to represent things as a Graph.
Some things are easy to see as a graph. Bridges and Landmasses, People following other people, bank loans to other banks, for example.
Some things are easy to see as a graph. Bridges and Landmasses, People following other people, bank loans to other banks, for example.
Things that you use every day being represented as a graph sometimes allows new insight to be given to the tools you are used to working with.
An Entity Relationship Diagram (ERD) is typically used by Data Architects to design the storage mechanism for an application in a relational database.
 |
| Entity relationship diagram, essential for the design of database tables, extracts, and metadata. (Photo credit: Wikipedia) |
There are tools that allow a designer to create an ERD, and generally they are focused on creating the most efficient Relational data model for the Relational database engine where the application will be storing its data. ERWin is a really good tool for this.
These tools generally do not include the capability to do an analysis of the Graph itself. When I refer to the “Graph” itself (in this context), I am referring to the structural artifact that is generated when a relationship is established between two entities in an ERD. These concepts are based in Graph Theory
One thing that may make it difficult to fully make the transition from a proper ERD to a Graph is that an ERD is very granular with all of the attributes of every Entity documented to a great level of detail.
To translate this to a Graph, the low-level details need to
be trimmed off. The entities themselves, and the relationship between them
should be captured in a format that a Graph analysis tool can use.
Many Graph analysis tools are also referred to as Social
Network Analysis tools. The Graph analysis tool I find most useful is Gephi.
By doing this, translating an ERD to a Graph and performing a Social Network Analysis on it, what can we learn?
By doing this, translating an ERD to a Graph and performing a Social Network Analysis on it, what can we learn?
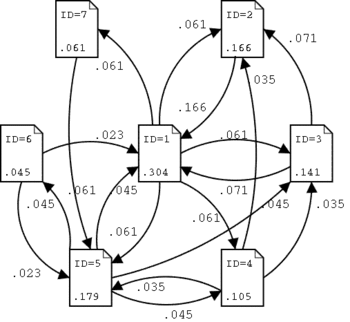
If the ERD is translated properly to a Graph format, once you gather the statistics that are a part of Graph Theory on the Data Structure you are analyzing, interesting things are found.
 |
| This is how the PageRank works. (Photo credit: Wikipedia) |
This table should be given precedence for indexes and database utilities like gather statistics.
For a full blown application, if performance problems arise, SQL queries should be examined where this table is referenced. Perhaps even more caching should be done to keep this particular table, and those that have a similarly high PageRank score in memory.
What other insights could be gained by doing a Graph analysis on a Data Structure?
I have published an analysis tool written in R to start people on the journey of analyzing data Structures at Data Structure Graph Shiny Application.
The format that this application requires is easily imported into Gephi, and the analysis discussed above can be done with just a few clicks.
This particular type of Data Structure Graph, I refer to as a Data Structure Graph Level 1.
No comments:
Post a Comment